Theory of Light and Color
23. Color Classification Systems (Part 3): CIE XYZ System
While the Munsell color system is the standard color chart system, the CIE-XYZ color system is the representative color mixing system.
(1) Advantages and Disadvantages of Color Chart Systems
The Munsell color system is based on the three psychological attributes of color (hue, value, and chroma) and is widespread because of its ease of use. However, as described in the last chapter, its application is limited because it has certain disadvantages:
a) Applicable only to object color
b) Unsuited for high-precision color measurements
c) No strict evaluation conditions ≪1≫
(2) CIE Color System
While not as intuitive as color chart systems, the CIE color system can be applied to the color of both light sources and objects, making it useful for LED lighting. There are many CIE color systems, such as the RGB color system, XYZ color system, L*a*b* color system, and L*u*v* color system. This chapter will introduce the most well-known version, the XYZ color system. ≪2≫
As explained in Chapters 11 through 13, the CIE color system is based on how humans recognize colors. In the case of object color, the light from a light source hits the object and is reflected (or transmitted) into the eye. On the other hand, the light from a light source directly enters the eye, and the brain recognizes its color without the intervention of an object.

In the simplest terms, the XYZ color system is a representation of light using three parameters corresponding to the stimulation of the three types of cone cells.
(3) CIE xy chromaticity diagram
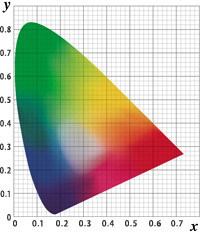
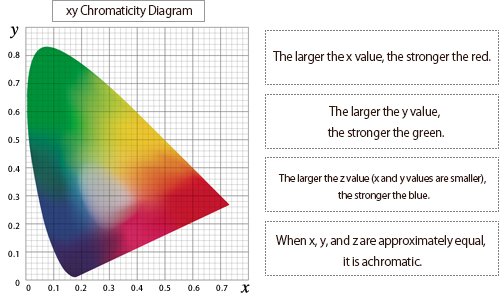
The CIE color system mathematically displays colors in coordinates. You may have seen a figure like the one on the right, known as the xy chromaticity diagram. In this display system, all colors correspond to a coordinate position (x, y) within the horseshoe-shaped area of the plane and a numerical value (Y) that represents brightness.
A color is specified by numerical values (Y, x, y), and increasing the number of significant digits makes it possible to display colors mathematically with high precision. Three significant digits are used in most cases, which is much more detailed than color charts.
(4) Hue in the xy chromaticity diagram
Hues are arranged sequentially counterclockwise from red to yellow-red, yellow, yellow-green, green, blue-green, blue, blue-purple, purple, and red-purple. The area around (x, y) = (0.333, 0.333) is achromatic.
The curved outer boundary is called the spectral locus (or monochromatic light locus) and is ordered according to the colors of the rainbow. The straight boundary at the bottom of the horseshoe is called the line of purples, which is formed by the chromaticity points of the red and purple additive mixing colors located at both ends of the spectral locus, according to their mixing ratios.
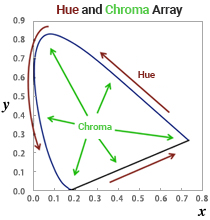
(5) Chroma in the xy chromaticity diagram
The farther away from the achromatic area centered on (x, y) = (0.333, 0.333), the higher the chroma. The highest chroma for each hue is located along the spectral locus and the line of purples.
(6) Value in the xy chromaticity diagram
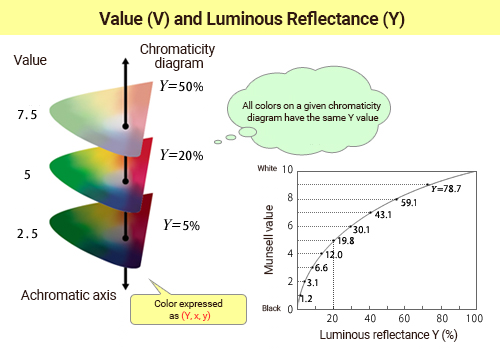
In the XYZ color system, the value of an object color is represented by its luminous reflectance (transmittance) Y. ≪3≫ For each Y value, there is a chromaticity diagram with a corresponding level of brightness.
The colors on any given xy chromaticity diagram all have the same luminous reflectance Y. When the luminous reflectance is higher, the achromatic area is whiter. As the Y value becomes smaller, the entire chromaticity diagram becomes darker. The achromatic area also darkens to gray, then black.
This is known as the CIE xyY color system. You can refer to Comment ≪5≫ in the previous section, which explains how the Munsell value has a logarithmic relationship with luminous reflectance Y.
(7) Overview of the XYZ Color System
If the spectral distribution of light is P (λ) and the spectral reflectance (transmittance) of an object ≪3≫ is ρ (λ), then the spectral distribution characteristics of light incident to the eye will be the product of P (λ) ・ ρ (λ). That light stimulates the cone photoreceptor cells, and the brain recognizes color by the ratio of the amount of stimulation. The color-matching functions x (λ), y (λ), and z (λ) are mathematically manipulated based on the wavelength sensitivity (spectral sensitivity) of cone cells.≪4≫
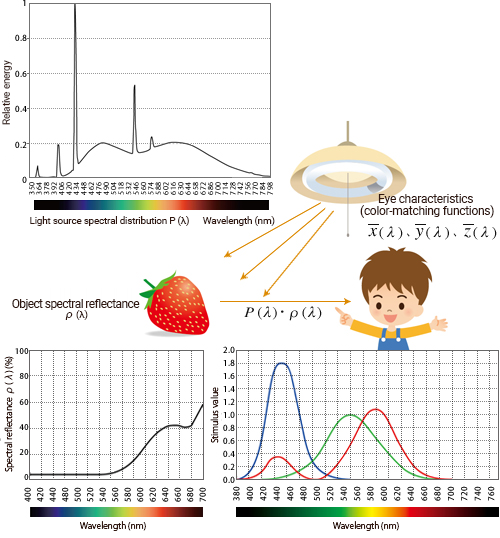
The graph (above right) shows a simple explanation of the properties of the three color-matching functions.
1) x (λ) represents the properties of the L-cones (mainly sensitive to the long visible wavelength range).
2) y (λ) represents the properties of the M-cones (mainly sensitive to the middle visible wavelength range).
3) z (λ) represents the properties of the S-cones (mainly sensitive to the short visible wavelength range).
Light with spectral distribution characteristics of P (λ) · ρ (λ) enters the eye and stimulates the L-, M-, and S-cones on the retina. When the stimulus values are expressed as X, Y, and Z, respectively, the following can be written:
Km is a constant called maximum luminous efficacy. (Km = 683 [lm / W])
As previously explained, the Y value is the luminous reflectance (transmittance) for object color. ≪5≫
In addition, the above equation can be applied to both the object color and the light source color. For light source color, ρ (λ) = 1.
The brain recognizes colors by the ratio of these stimulus values. The chromaticity value (x, y) above is defined according to the brain's recognition.
In other words, x is the ratio of the stimulus value received by the L-cones (X) to the total amount of stimulus received by all cone cells (X + Y + Z), and y is the ratio of the stimulus value received by the M-cones (Y) to (X + Y + Z).
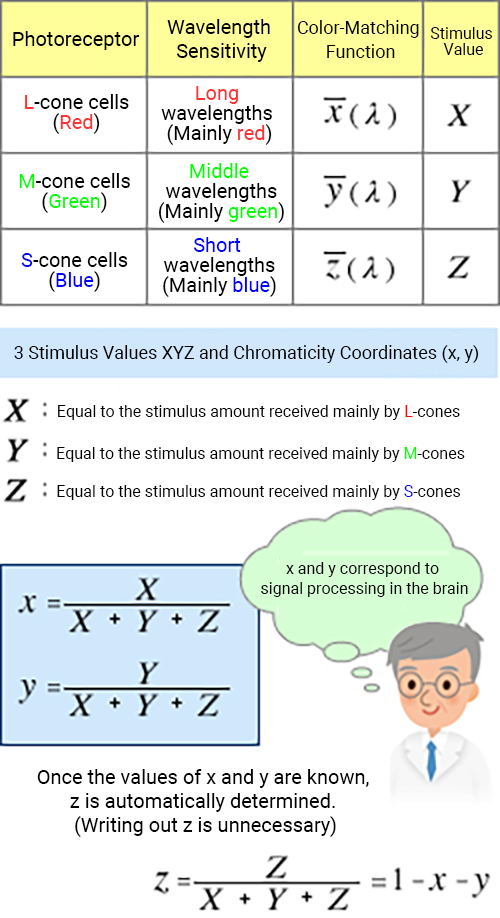
Similarly, z is the ratio of the stimulus value of the S-cones (Z) to (X + Y + Z).
In all the above three equations, x + y + z = 1. Once the values of x and y are determined, the value of z = 1 - x - y, so there is no need to expressly write out z. ≪6≫
Looking at the chromaticity diagram with this newfound understanding of the XYZ color system's hue arrangement described above, the larger the x value, the stronger the red because the L cones (mainly sensitive to long wavelengths) are the most strongly stimulated. Similarly, the larger the value of y, the stronger the green. Furthermore, z = 1 - x - y is greater when (x, y) is small, thus the stronger blue tint near the lower left of the xy chromaticity diagram.
On the other hand, when the three types of cone cells receive a similar level of stimulation, x, y, and z have approximately the same value, or x ≒ y ≒ z ≒ 0.333. The achromatic area correlates to these coordinates (x, y) = (0.333, 0.333) in the xy chromaticity diagram.
(8) CIE Standard Illuminants
When the spectral distribution P (λ) of the light source changes, so does the spectral characteristics P (λ)・ρ (λ) of the light entering the eye. The object color will look different even if the object is the same. Consequently, the X, Y, and Z stimulus values and the chromaticity coordinates also change. The flexibility of the (x, y) color display system is that it can obtain chromaticity data under any lighting conditions.
Light source characteristics must be specified and consistent to compare objects objectively. The CIE (Commission internationale de l'éclairage) has stipulated universal standard characteristics of typical light sources for evaluating and displaying object colors. Of these standard illuminants, the following two represent the most "natural light" humans have been most accustomed to over time. Both have a continuous spectrum in which energy is distributed without interruption over the entire visible range.
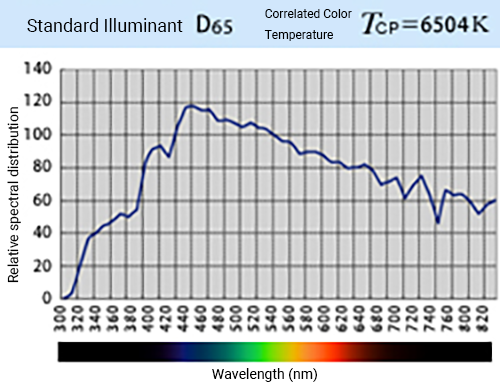
1) Standard Illuminant D65
Illuminant D65 represents natural white light in the daytime based on the measurements of sunlight (daylight) on a sunny day, and the relative energy ratio for each wavelength is determined numerically. (Correlated color temperature Tcp = 6504 K ≪7≫)
In addition to the visible range, it specifies the energy in the ultraviolet range, which is relevant when evaluating fluorescence. ≪8≫
2) Standard Illuminant A
Illuminant A represents thermal radiation-type light sources used as nighttime light sources, such as candles and bonfires, and incandescent light bulbs, which are artificial light sources. It emits light from a black body with a color temperature of 2856 K. ≪7≫ The spectral distribution is concentrated in the long-wavelength range, giving it a reddish tint (see figure right).

Since the spectral distribution P (λ) of a standard illuminant is well-defined, if the spectral reflectance (transmittance) ρ (λ) of the object is measured, the chromaticity values of the sample can be calculated using the x (λ), y (λ), z (λ) color matching functions.
Comment
≪1≫ Observation conditions for color chart systems
Various conditions have been specified for measuring object color using a color chart, such as the spectral distribution of the light source, direction of illumination of the sample color/color chart, observation direction, area of the sample color/color chart (viewing angle size), illuminance level of sample color/color chart surface, color vision of observer, etc. (JIS Z 8723: 2000)
However, it is not as strictly defined as the observation (measurement) conditions of the CIE color system. Furthermore, those observation conditions are often not consciously applied in practice, so the reproducibility of evaluation results can be questionable.
≪2≫ CIE color system
CIE is an abbreviation for the Commission internationale de l'éclairage (French), an organization that examines and creates international standards for light and color. The set of color systems studied and adopted by this organization is called the CIE color system.
There are various types of color systems, even in the CIE color system. Of those, the RGB color system forms the basic theoretical principle of color representation. However, due to problems in practical application, the XYZ color system (a mathematical conversion of the RGB color system) is the most basic color system used.
Even the XYZ color system has intrinsic problems concerning the color difference between multiple types of colors (due to the non-uniform color difference space). Other color systems, such as the L*a*b* color system and the L*u*v* color system, have been developed by mathematically transforming from the XYZ color system.
≪3≫ Stimulus value Y and luminous reflectance (transmittance) Y
As described in Chapter 10 Comment ≪1≫, although we use the term reflectance (transmittance) for simplicity, it is technically the luminance factor when the reflection surface (transmission surface) is observed from a certain angle.
The luminous reflectance (transmittance) Y of the object color is the reflectance (luminance factor) evaluated at the standard spectral luminous efficiency V (λ), which is the sensitivity of the human eye. It is the ratio of the luminance of the sample surface from a given observation direction to the luminance of a perfect reflecting diffuser (transmitter) from that observation direction. With object color, luminous reflectance Y defines the stimulus value Y.
Reflectance (transmittance) only applies to object colors and not light source colors. The stimulus value Y of light source color is expressed as an illuminance value (unit: lx) or a luminance value (unit: cd / m2).
≪4≫ Color-matching functions
As mentioned, the color-matching functions x (λ), y (λ), and z (λ) are defined by the spectral response properties of the three cones (L, M, S) of the photoreceptor cells. For example, the characteristics of M-cones are the principal determinant for y (λ), with added sensitivity where there is overlap with the L and S cones. A detailed understanding of color-matching functions requires an explanation of the RGB color system, which is the most basic principle of the CIE color system. We will talk about the development of the RGB color system into the XYZ color system in the next chapter.
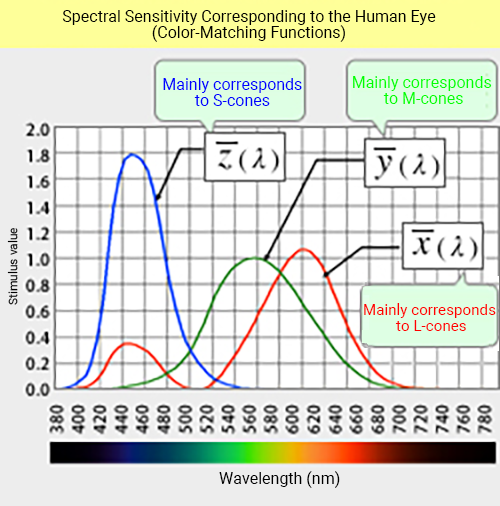
The unnatural shape of the x (λ) curve is because of the mathematical coordinate transformation of the primary colors of the RGB color system, R, G, and B, to the three "primary colors" of the XYZ color system, X, Y, and Z.
≪5≫ Standard spectral luminous efficiency V (λ) and color-matching function y (λ)
The color matching function y (λ) is the same function as the standard spectral luminous efficiency V (λ). Brightness is a one-dimensional psychophysical quantity, while color is a three-dimensional psychophysical quantity (hue, value, and chroma). Historically, the study of the eye's perception of brightness came before research on color. As you know, the attribute for brightness is value. That is why the standard spectral luminous efficiency V (λ), which was already established, was incorporated into the color evaluation/display system.
≪6≫ Two-dimensional display of the xy chromaticity diagram
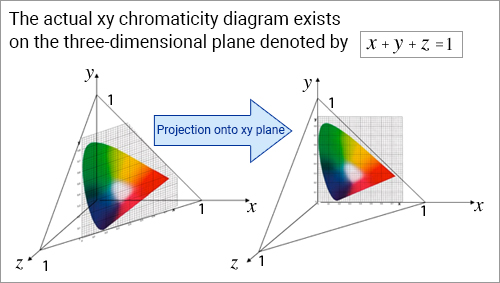
As described above, in the XYZ color system, x + y + z = 1 always holds for any color (regardless of where the chromaticity point is located within the horseshoe shape on the xy chromaticity diagram). Algebraically, it shows the equation of a plane with intercept 1 on each axis in a three-dimensional coordinate space consisting of the x-axis, y-axis, and z-axis. Although the xy chromaticity diagram exists on a three-dimensional plane, it is not intuitive for people to think of a three-dimensional space in their heads. By projecting the chromaticity diagram onto the x-y plane, it becomes easier to visualize in your head, which is why it is displayed on a 2D plane.
≪7≫ Color temperature and correlated color temperature
Color temperature and correlated color temperature are indicators of the color tones of a white light source, measured in Kelvins (K). Light with a high (correlated) color temperature appears bluish, and light with a low (correlated) color temperature appears reddish.
≪8≫ Fluorescent color and standard illuminant D65
Highlighters, fluorescent clothing, and other items containing fluorescent substances are all around us, and their colors look a little different from ordinary objects, almost like a pseudo-light source. When a fluorescent substance is irradiated by light with a certain wavelength (excitation light), it emits light with a longer wavelength than the irradiated light as fluorescence.
The wavelength and intensity of the fluorescence affect the color of the object. Therefore, when evaluating the color of an object with fluorescence properties, it is important to know the characteristics of the light source, especially the wavelength range where excitation can occur, the near-ultraviolet range.