Theory of Light and Color

24. Color Classification Systems (Part 4): CIE RGB to XYZ
The previous chapter gave a general overview of the CIE XYZ color system, a fundamental representation of color mixing. This chapter is an in-depth explanation of how it was created.
(1) Additive Mixture of Color Stimuli: Primary Colors of Light
As described in Chapters 15 and 16, additive color mixing can create various colors by mixing the three primary colors of red, green, and blue colored light. In this case, the mixing ratio of the three primary colors determines the resulting color, and this principle forms the basis of the XYZ color system.
(2) Color Matching Experiment
The XYZ color system adopted by the CIE (Commission internationale de l'éclairage) in 1931 was constructed based on the results of a color-matching experiment using monochromatic lights of the below wavelengths [R], [G], and [B] as the three primary colors of light. ≪1≫
[R]: λR = 700.0 nm
[G]: λG = 546.1 nm
[B]: λB = 435.8 nm
The experiments compared the results of additive mixing of the three primary colors with the colors of monochromatic light at various wavelengths to obtain the color mixing ratio that achieved the same color (color-matching).
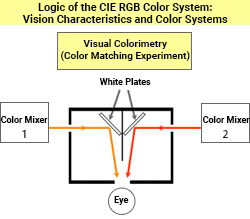
Refer to the experiment’s setup in the upper right figure. The colors of the light reflected off the white plates are compared simultaneously in the left and right fields of vision to determine whether the colors appear the same or not.
For example, a sample monochromatic light of a certain wavelength λ (F) shines from the left hole, and light that is an additive mixture of the three primary colors shines from the right hole.
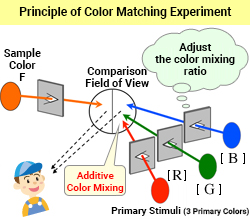
The additive mixture of the three primary colors [R], [G], and [B] has a mixing ratio of r:g:b. It can be expressed as
r・[R] + g・[G] + b・[B]
When the left and right fields of view are the same after adjusting the color mixing ratio, it can be expressed as
F ≡ r・[R] + g・[G] + b・[B]
The ≡ symbol in color science means that the colors appear to be the same.
(3) RGB Color System Color Matching Functions
This experiment can find the matching color mixing ratio for any given monochromatic light F with wavelength λ. (The wavelength λ of the sample monochromatic light is treated as a variable, represented by F (λ), r (λ), g (λ), and b (λ) in the following description.) The resulting color mixing ratio characteristics for each wavelength are called the isochromatic functions of the RGB color system. ≪2≫ For example, monochromatic light F (600) with wavelength λ = 600 nm has a color mixing ratio of
r (λ) = 0.3443, g (λ) = 0.0624, and b (λ) = 0.0005.
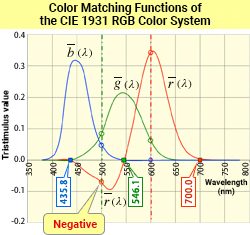
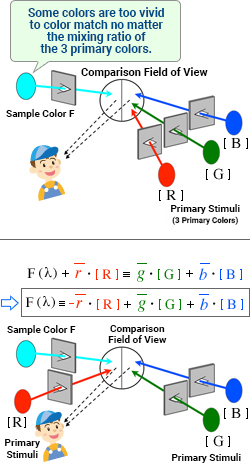
Note there is a wavelength range where the value of the color-matching function r (λ) is negative between 435.8 to 546.1 nm. ≪3≫ In this range, F (λ) is too vivid to color match no matter how the mixing ratio [R], [G], and [B] changes. However, by moving one of the three primary colors to the sample light F (λ) side and mixing it with the sample light, you can match the color with the remaining two primary colors. For example, in the case of monochromatic light F (500) with wavelength λ = 500 nm (cyan), if you mix it with red [R] where r (λ) = 0.072, and mix green [G] with blue [B] by the ratio g (λ) = 0.085 and b (λ) = 0.048, the colors on both sides match, obtaining the following formula:
F (λ) + r (λ)・[R] ≡ g (λ)・[G] + b (λ)・[B]
If you move r (λ)・[R] to the right side, it will become
F (λ) ≡ − r (λ)・[R] + g (λ)・[G] + b (λ)・[B]
This formula shows why the color-matching function r (λ) becomes negative at the wavelength λ = 500 nm.
(4) Chromaticity Diagram of the RGB Color System
(rg Chromaticity Diagram)
The resulting color matching functions r (λ), g (λ), and b (λ) define the stimulus values R, G, and B for the three primary colors [R], [G], and [B]. (k = constant)
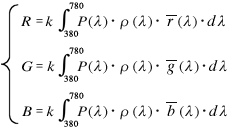
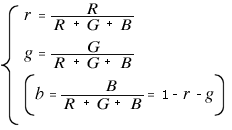
From the above, r, g, and b represent the ratio of red, green, and blue stimuli to the total stimulus, respectively.
The following figure shows the rg chromaticity diagram, with k on the horizontal axis and g on the vertical axis. ≪4≫

The curved portion of the rg chromaticity diagram is the spectrum locus. The numerical values shown in the figure indicate the wavelength of monochromatic light corresponding to the coordinate position. The straight line connecting both ends of the spectrum locus is the purple boundary. There are no chromaticity points of monochromatic light on the purple boundary, but rather chromaticity points of colors obtained through additive color mixing of monochromatic light at both ends of the visible spectrum.
All colors in the world are represented by chromaticity points in the area surrounded by the spectrum locus and the purple boundary. The achromatic color created by evenly mixing the three primary colors is located at (r, g) = (0.333, 0.333), indicated by "W+."
Looking at the rg chromaticity diagram, the chromaticity range covers a significant portion of the second quadrant (r < 0, g > 0). This area, where r < 0 (R < 0), indicates the color range that cannot be created by the additive mixing of the three primary colors [R], [G], and [B].
The negative color matching function values are one of the downsides of the RGB color system because it is difficult to understand intuitively. And before technological advancements, the negative values made it complicated to calculate.
The "imaginary" primary colors [X], [Y], and [Z] were set to avoid color matching functions with negative values, thereby creating the XYZ color system.
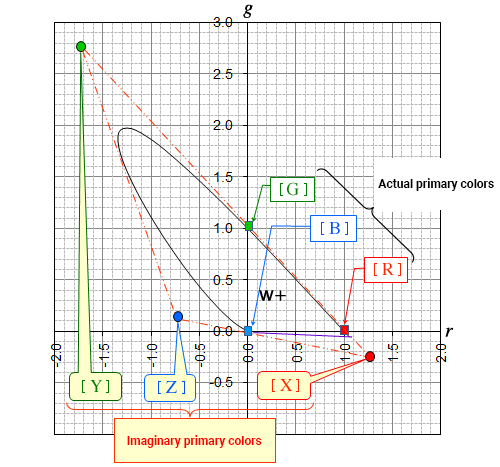
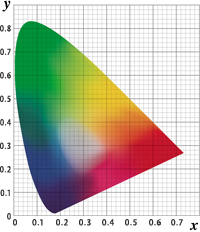
The stimuli [X], [Y], and [Z] are vertices and form a triangle that circumscribes the gamut of the rg chromaticity diagram as shown above. This makes it possible to display all the coordinate points in the color area with a non-negative mixing ratio of [X], [Y], and [Z]. If the coordinates are transformed so that the straight line connecting [Y] and [Z] in the figure is on the vertical axis and the straight line connecting [Z] and [X] is on the horizontal axis, the entire color gamut can be represented within the first quadrant of the Cartesian plane. In addition, the chromaticity diagram obtained by adding y (λ) ≡ V (λ) as a condition for "lightness" and transforming the coordinates is the xy chromaticity diagram (right figure) of the XYZ color system. ≪5≫
(5) Relationship Between Tristimulus Values X, Y, and Z and Photoreceptor Cells
As a result of the coordinate transformation described above, there is a relationship expressed by the following formula between the tristimulus values R, G, and B of the RGB color system and the tristimulus values X, Y, and Z of the XYZ color system.
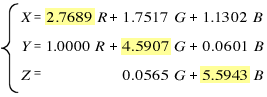
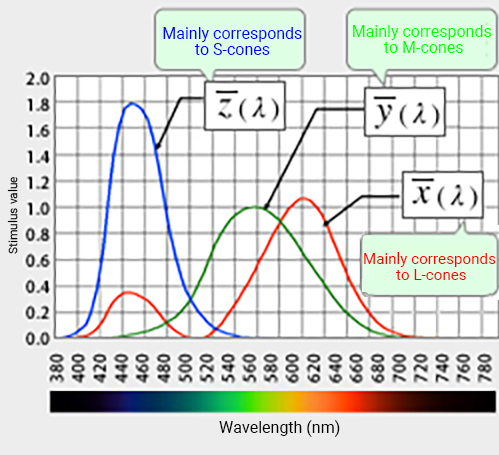
Note the coefficients of R, G, and B in these relational expressions. The coefficients highlighted in yellow are significantly larger than the others. In other words, it indicates that the stimulus value X is mainly composed of R, with some G and B. Similarly, the stimulus value Y is mainly composed of G, with some R and B, and the stimulus value Z is mainly composed of B, with some G. You can see this by looking at the graphs of the color-matching functions x (λ), y (λ), and z (λ) in the XYZ color system.
To put it another way, the stimulus value X is a mix of all three cone responses, but mainly the L response. The value Y is also a mix but with a higher M response. And finally, Z is almost entirely made up of the response to the S-cones. In this way, the CIE color system is constructed using data obtained by experiments that characterize color vision properties based on the function of human photoreceptor cells.
Comment
≪1≫ Wavelengths of the three primary colors of monochromatic light set by the CIE
The primary colors of blue (λB = 435.8 nm) and green (λG = 546.1 nm) came from the emission spectrum of mercury, which was relatively accessible in 1931. The red primary color was supposedly selected as the longest wavelength in the visible range that would induce a certain level of color sensation in practical use.
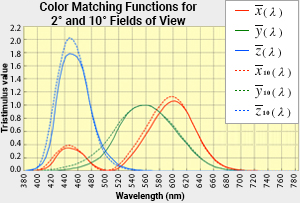
≪2≫ Color matching functions and viewing angle (2° and 10° fields of view): area effect of color
The "area effect" of color describes how colors appear slightly different to the human eye depending on the area of the sample color (size of the viewing angle). This happens because only the central area of the fovea (approximately 2-degree viewing angle), where photoreceptor cells are densely distributed on the retina, is covered with macular pigment and has slightly different color vision characteristics than other areas of the retina.
Therefore, the viewing angle must be specified to accurately evaluate colors with the right color matching functions. A color matching function using a 2° field of view was specified in 1931, but subsequent research needed a color-matching function suitable for evaluation at a larger viewing angle (wide sample area). In 1964, the color matching functions x10 (λ), y10 (λ), and z10 (λ) with a 10° field of view were decided on as a representative condition. The RGB color matching function in the text is for a 2° field of view. The color matching function with a 2° field of view should be used when the viewing angle of 4° or less, and the 10° field of view version should be used for viewing angles over 4°.
≪3≫ Negative color matching functions
Of the three functions of F (λ), r (λ) is the most prominent in terms of the negative value magnitude, but even in g (λ) and b (λ), there are small wavelength ranges that are also negative.
≪4≫ Coordinates of the three primary colors on the chromaticity diagram
With three variables, it would make sense to display r, g, and b on three-dimensional Cartesian coordinates with an r-axis, g-axis, and b-axis. However, chromaticity can only be displayed on the r-g plane because the value of b is automatically fixed once the r and g values are determined. The coordinate position of each primary color corresponds to intercept 1 on each axis. In other words, the primary color [R] is (r, g) = (1, 0), and the primary color [G] is (r, g) = (0, 1). In addition, since the primary color [B] is b = 1, r = g = 0, it is the origin point (r, g) = (0, 0) on the rg chromaticity diagram.
≪5≫ Coordinate transformation from RGB to XYZ color system
By using the XYZ color system, there are no challenges dealing with negative stimulus values (negative color matching function) like the RGB color system. The coordinate conversion also matches the color matching function y (λ) to the spectral luminous efficiency V (λ), the function that evaluates lightness. In doing so, the hue and chroma of the three psychological attributes of color correspond to the chromaticity coordinates (x, y), and lightness correlates to the stimulus value Y.
Historically speaking, research on lightness, which is one-dimensional information, came before color, which has three dimensions: hue, chroma, and value (lightness). This naturally led to color display systems that incorporate V (λ), a quantitative evaluation function for lightness already established at the time of designing a system for quantitatively displaying color.