Theory of Light and Color

25. Color Produced by the Three Primary Colors: Blue LEDs and White Light
On October 7, 2014, the Nobel Prize in Physics was awarded to three individuals: Isamu Akasaki, a professor at Meiji University, Hiroshi Amano, a professor at Nagoya University, and Shuji Nakamura, a professor at the University of California, Santa Barbara. They are highly regarded for having paved the way for the current era of LEDs, from material development to mass production technology.
Red and yellow-green LEDs already existed in the 1960s, but blue LEDs were seen as difficult to put into practical use during the 20th century due to high technical barriers. With the realization of blue LEDs that emit short wavelengths of the visible range, it became possible to develop energy-efficient LED white light sources that lasted longer than incandescent lamps and fluorescent lamps.
There was one technical inaccuracy in media reports at the time. In explaining that all three primary colors of light were available, most news outlets said that all colors can be created with the three primary colors of red, green, and blue. In reality, almost all colors can be created.
(1) Color Reproduction Range of the Three Primary Colors
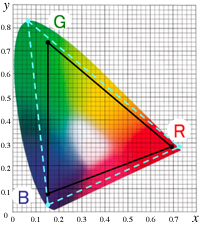
The color range (color gamut) that can be created by additive mixing of the three primary colors red [R], green [G], and blue [B] is the area inside of △RGB, which is formed by connecting the chromaticity coordinate points R, G and B on the xy chromaticity diagram. As explained in the previous chapter, colors outside of △RGB are too vivid to produce. Since the spectrum locus of the xy chromaticity diagram bulges outward, there will always be areas outside of △RGB. ≪1≫
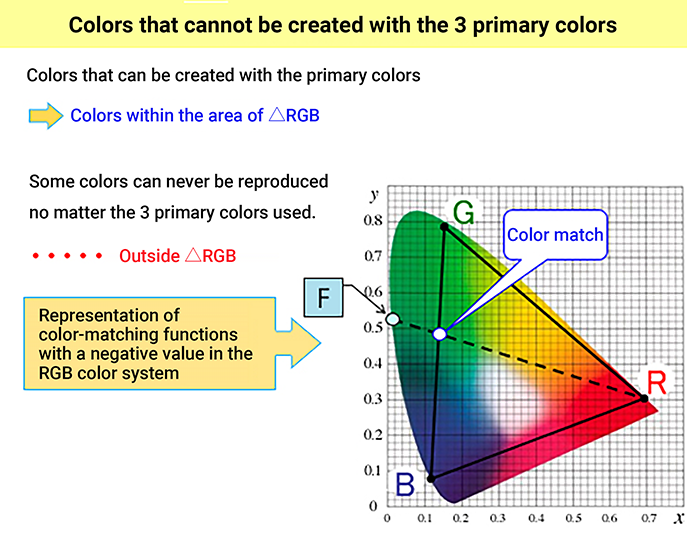
For example, the colors of the rainbow are the colors of monochromatic light refracted and dispersed by water droplets, so their chromaticity points are on the spectrum locus outside the triangle of the three primary colors. The colors of the rainbow seen in print and digital media are not perfect reproductions. Even in the chromaticity diagram used in this series, the colors near the spectrum locus and purple boundary are not accurate reproductions of the actual colors.
(2) The Triangular Color Gamut
So why are colors produced by additive color mixing of the three primary colors [R], [G], and [B] limited to the inside of △RGB in the xy chromaticity diagram? The xy chromaticity diagram is a mathematically linear space, which is why the resulting chromaticity point from mixing two colors is on a straight line connecting the two colors. The color mixing of the three colors [R], [G], and [B] can be divided into two steps, for example, mixing [R] and [G] first, then mixing the resulting color with [B]. In the end, the chromaticity point of the resulting color is always inside of the triangle (△RGB) formed by the chromaticity points of the three primaries.
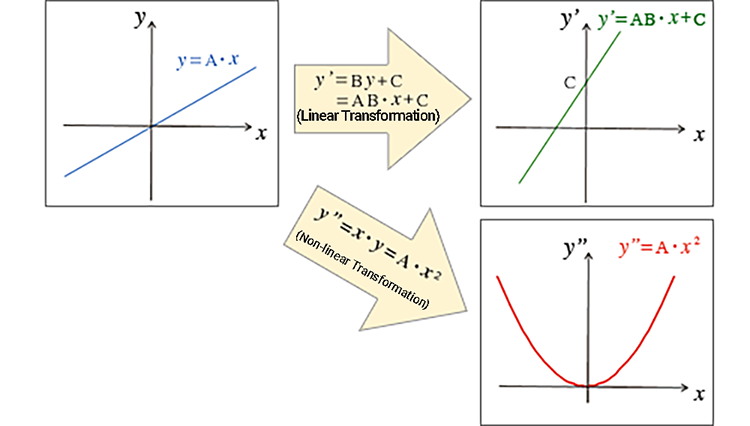
(3) Linearity
Linearity in this case refers to a mathematical transformation represented by a linear expression. The simplest linear expression is, for example, y = A・x (A: constant). y = A・x means that x and y are in direct proportion, and the graph in the xy plane is a straight line with a slope A through the origin. In this way, the graph is linear with a constant ratio (△y / △x = A) represented by a straight line.
If the operation y' = B・y + C = AB・x + C (B, C: constants) is performed on y = A・x, the vertical axis becomes the y' coordinate (the horizontal axis remains as x). The graph becomes a straight line with a slope of AB and an intercept of C. While this operation transforms the coordinates from x y coordinates to x y' coordinates, the graph is still a straight line.
Now consider a transformation using the operation y" = x・y = x・(A・x) = A・x2. The straight line turns into a quadratic curve (parabola) on the x y" coordinate. In summary, a linear expression (an expression where the power of a variable is 1) transforms a straight line into another straight line. Such a transformation is called a linear transformation. A non-linear transformation converts a straight line into a curve.
(4) Relationship Between Additive Color Mixing and Linearity
The tristimulus values (R, G, B) of the RGB color system represent the intensity of the stimulus of light incident to the eye as you can see from the formula ≪2≫, and each is proportional to the light intensity entering the eye.
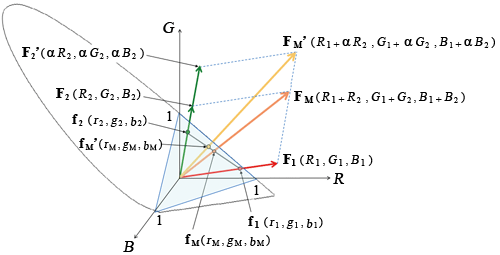
Think about a color [F], whose tristimulus values are R, G, and B in the RGB color system. This color [F] can be interpreted as a vector of F (R, G, B) if the tristimulus R, G, and B are considered as the three axes of R, G, and B in the Cartesian coordinate space.
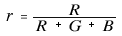
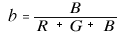
On the other hand, the chromaticity coordinates (r, g, b) in the RGB color system are defined by the ratio of each stimulus value to the total stimulus value.

Since r + g + b = 1, the point where the vector F (R, G, B) intersects the plane R + G + B = 1 can be interpreted as the chromaticity coordinates (r, g, b). The chromaticity coordinate vector is f (r, g, b).
Now, consider the case where mixing two colors [F1] and [F2] produces [FM]. If the result of mixing F1 (R1, G1, B1) and F2 (R2, G2, B2) is FM, each stimulus value is
RM = R1 + R2
GM = G1 + G2
BM = B1 + B2
The derived vector formula is F1 (R1, G1, B1) + F2 (R2, G2, B2) = FM (R1 + R2, G1 + G2, B1 + B2).
This sum vector FM exists in the plane determined by the two vectors F1 and F2 and is the diagonal of a parallelogram with the vectors F1 and F2 as two adjacent sides. Therefore, the intersection of the plane containing vectors F1, F2, and FM (parallelogram) and the plane of R + G + B = 1 is a straight line at the intersection of the planes. The chromaticity coordinate vectors
f1 (r1, g1, b1)
f2 (r2, g2, b2)
fM (rM, gM, bM)
indicating the intersection of the vectors F1, F2, FM, and the plane R + G + B = 1 also exist on this straight line.
This means that the chromaticity point fM (rM, gM, bM) that results from mixing [F1] and [F2] exists on a straight line connecting the two color chromaticity points f1 (r1, g1, b1) and f2 (r2, g2, b2) on the RGB chromaticity diagram.
In addition, the chromaticity point fM (rM, gM, bM) is located at the point internally divided by the ratio of the magnitude of the vector of F1 (R1, G1, B1) and F2 (R2, G2, B2) (the magnitude of the stimulus value). ≪3≫
The linear relationship (linearity) is preserved in the rg chromaticity diagram, which is a projection of the RGB chromaticity diagram onto the rg plane.
The XYZ tristimulus values are a result of the following coordinate transformations for tristimulus values R, G, and B of the RGB color system.
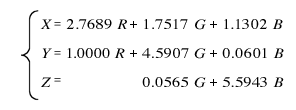
Since this coordinate transformation is a linear transformation formula, the linearity of the rg chromaticity diagram of the RGB system is still present in the xy chromaticity diagram. ≪4≫
(5) White LED Light
Blue LEDs made it possible to develop white LED light sources, which expanded the adoption of LEDs in various fields.
There are two methods for achieving white light with LEDs:
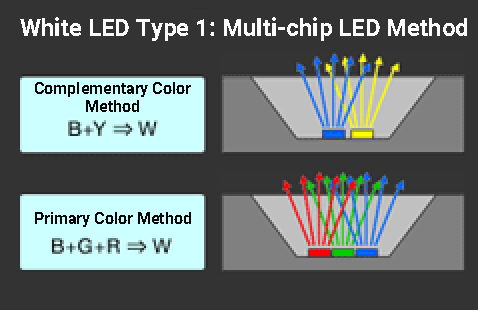
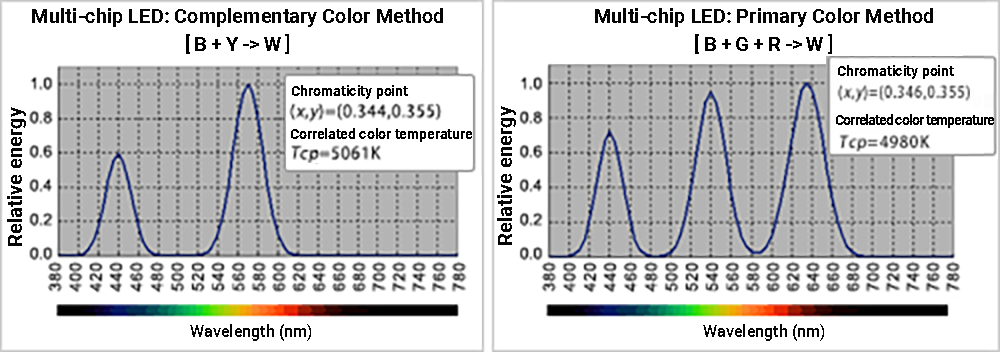
1) Multi-chip LED method (RGB method and complementary color method)
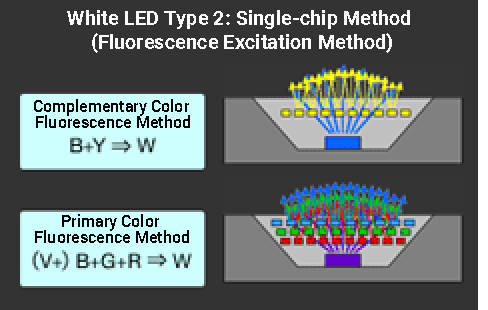
2) Single-chip method (Fluorescence excitation method)
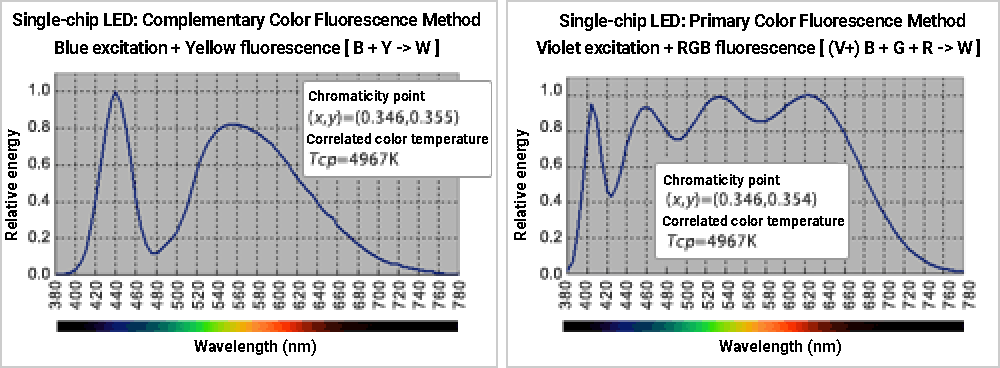
The single-chip method is more common because the full width at half maximum (FWHM) of a monochromatic LED’s emission spectral distribution is narrow, so the multi-chip LED method has large irregularities in its spectral distribution, which results in poor color rendering. ≪5≫
Even the blue-YAG type single-chip LED (complementary color fluorescence method), which has been mainstream because of its energy efficiency and cost, has poor color rendering properties due to its extremely uneven spectral distribution in addition to higher correlated color temperature. ≪6≫
In recent years, white LEDs have used ultraviolet, blue, or purple LEDs as excitation light sources and optimized the combination of multiple types of phosphors. This method produces a more even continuous spectrum across the entire visible range, improving the color rendering properties of white light sources. ≪7≫
To return to the story mentioned at the beginning, blue LEDs have made it possible to produce better white light sources with LEDs in combination with phosphor technology. This blue LED technology has evolved further, and nowadays, ultraviolet LEDs with shorter wavelengths (higher energy) than the visible range are also available.
Comment
≪1≫
Since the spectral distribution of LEDs is not pure monochromatic light, but rather a light source with a narrow FWHM of several tens of nm or less, it is located slightly inside the spectrum locus in the xy chromatic diagram.
Even if all three primary colors are monochromatic light (e.g., color matching experiment using the RGB color system), the area △RGB (color gamut) becomes large, but the area outside the triangle always remains.
≪2≫ Definition of the tristimulus value in the RGB color system
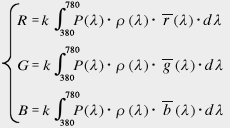
P (λ): Spectral distribution of illumination light
ρ(λ): Spectral reflectance of the object
(For the light source, set ρ (λ) = 1)
r (λ), g (λ), b (λ): Matching functions of RGB color system
k: constant
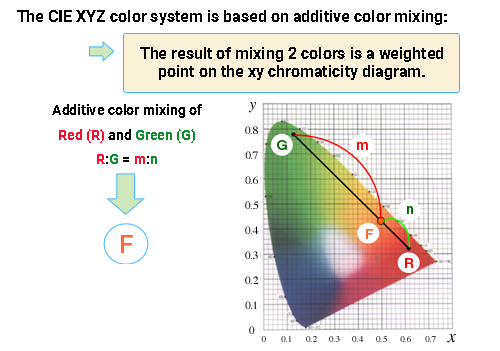
≪3≫ Color mixing ratio in the xy chromaticity diagram
Consider two types of light colors [G] and [R], and let their chromaticity coordinates be G (xG, yG) and R (xR, yR) respectively. If the chromaticity coordinates of the color [F] when these two colors are mixed in the ratio of m:n are F (xF, yF), the following equation is derived.
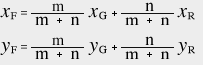
This shows that the chromaticity point F (xF, yF) is obtained by internally dividing the straight line GR by m:n on the chromaticity diagram. Due to the linear space of the xy chromaticity diagram, the chromaticity points of the mixed color are on the straight line connecting the chromaticity points of the two colors. In addition, the internal division point is proportional to the color mixing ratio.
≪4≫ Non-linear transformation to uniform color space
The CIE L* u* v* color system and the CIE L* a* b* color system are transformed from the non-uniform XYZ color system to a uniform color space using a non-linear expression (operation to the power of 1/3), so the linearity is not preserved. Therefore, in these uniform color spaces, the resulting color is not on a straight line on the chromaticity diagram.
≪5≫ Color rendering
An object’s apparent color changes depending on the characteristics of the light that illuminates it. How the color of an object looks based on the light source is called color rendering, and the color rendering property of a light source determines the color rendering effect.
≪6≫ Color temperature and correlated color temperature
Even "white light" has varying spectral distributions. Some look reddish (candles and incandescent lamps) and others look bluish-white (sunlight in the daytime). Color temperature and correlated color temperature measure the color of white lights.
≪7≫ Fluorescence and white LEDs
In Comments ≪2≫ and ≪3≫ of Chapter 2, we briefly explained the relationship between the light generation mechanism and energy. To recap, light absorption is a phenomenon in which light energy ΔE is transferred to the electron energy of a substance through the interaction between the light incident to it and its electrons. Light emission occurs when electron energy ΔE is released from an atom in the form of electromagnetic waves as a result of the electron’s transition from a state of high energy EH to low energy EL. The energy of this electromagnetic wave (light) is the difference in the energy levels and is proportional to the frequency v of light (inversely proportional to the wavelength).
ΔE = EH –EL = hv = h・c / λ
(h is Planck's constant, h ≒ 6.63 × 10⁻³⁴ Js)
Normally, the amount of energy transferred in both light absorption (EL → EH) and light emission (EH → EL) is equal to ΔE, so the wavelength of light does not change.
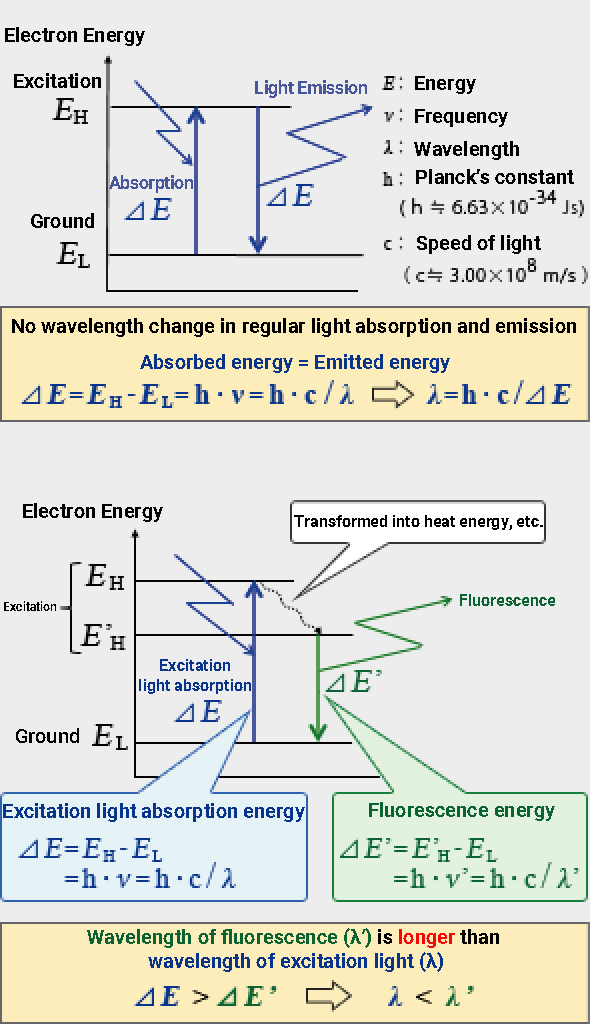
On the other hand, fluorescence is a little more complicated and involves multiple excitation levels. For the sake of simplicity, these excitation levels are EH and E’H.
(EH > E’H)
The electrons in the ground state absorb the energy ΔE of light (excitation light) and are first excited to the high energy level EH. In light emission with fluorescence, EH temporarily moves to another excitation energy level E’H (E’H < EH). This energy difference (EH – E’H) is not released as light but as heat (vibration) energy. When excited electrons move from E’H to the ground state EL, the energy ΔE’ (= E’H – EL) is emitted as an electromagnetic wave, which is fluorescence. Since fluorescence emission energy ΔE’ is less than energy ΔE when absorbing excitation light, the wavelength of fluorescence is always longer than that of excitation light.
With ordinary heat radiation light sources (incandescent lamps, etc.) and discharge lamps (mercury lamps, etc.), electrons are excited to a high level by supplying electricity to the lamp, and in the process of transitioning to a low energy level, the energy difference is released as electromagnetic waves (light). On the other hand, fluorescent lamps convert the energy of electromagnetic waves (ultraviolet radiation) emitted by fluorescent substances to a longer wavelength that re-emits as visible light.
The above explanation of fluorescence is simplified to two levels of excitation. In an actual fluorescent substance, electrons transition from many excitation levels to the ground state. Therefore, fluorescence is not a single wavelength but generally a wide wavelength range of several tens of nm or more, unlike monochromatic LEDs such as red or green. The wider bandwidth is what makes the fluorescent excitation method better than the multi-chip LED method for achieving the ideal characteristics of a white light source. The three primary color fluorescence method in particular has become mainstream technology because it can simultaneously generate fluorescence with different wavelengths using multiple types of phosphors and achieve high-quality white light with a continuous spectrum.
A semiconductor material with a larger bandgap ΔE is required to realize blue LEDs, which have a shorter wavelength than red and green. The development of this semiconductor material was the highest barrier to realizing blue LEDs, and it was the Nobel laureates who found the solution.