Theory of Light and Color

27. Light Source Colors: Color Temperature and Correlated Color Temperature
In fields related to lighting, color temperature is often used as a measure to describe the hue of light. For instance, the color of light from an incandescent bulb, which has a reddish hue, is said to have a low color temperature, while the color of light from a daylight fluorescent lamp, which has a bluish-white hue, is said to have a high color temperature.
As explained in previous chapters, the color of light can be objectively and accurately defined by specifying the chromaticity coordinates (x, y) in the XYZ color system. However, apart from color specialists, few can immediately associate coordinates with a color. Humans naturally find it easier to understand one-dimensional numbers. Color temperature is a practical value that expresses approximate color with a single number (at the expense of accuracy).
(1) History of the Concept of "Color Temperature"
Before delving into the precise definition of "color temperature," it may be easier to understand the concept by looking at its historical background. The concept can be traced back to the iron and steel industry during the Industrial Revolution when demand increased for the mass production of high-quality steel.
Steelmaking involves heating, melting, and refining iron sand or iron ore. Controlling the temperature of the molten iron inside the blast furnace is key to removing impurities while gradually cooling and solidifying it. If the temperature control is poor, it becomes impossible to ensure the quality of the finished steel. Of course, measuring the temperature of molten iron, which can reach several thousand degrees, was not a simple task at the time. It was one thing to measure high temperatures in laboratories, but another to measure it on the manufacturing floor where it could endanger workers.
Therefore, research focusing on the close relationship between the temperature and color of molten iron led to the development of color temperature.
(2) The Relationship Between Temperature and Color of a Blackbody (Perfect Radiator)
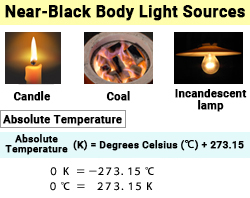
Coal is another substance where color and temperature are related. When you blow air (oxygen) into red-hot coals, they burn more intensely and the temperature rises, changing the color of the coals from red-black to orange.
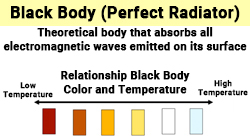
These heat sources emit light as they are heated and are therefore known as thermal radiation light sources. A radiation source (light source) with the ideal characteristics of these thermal radiation light sources is called a blackbody, or a perfect radiator.
A blackbody absorbs all incident electromagnetic waves, regardless of wavelength without any reflection, so at room temperature, it appears completely black. In reality, objects that look "completely black" still reflect some light, so a perfect blackbody does not exist and is considered a theoretical concept. Charcoal, coal, and molten iron are relatively close to being a blackbody.
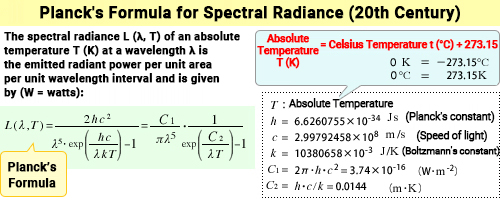
This research was conducted by the German physicist Max Planck, who derived a formula to describe the spectral distribution characteristics of electromagnetic waves emitted from a blackbody (Planck radiation law: see figure above). The significance of this formula is that once the absolute temperature T (in units of Kelvin, K) ≪1≫ of the blackbody is determined, the spectral distribution of the emitted electromagnetic waves is uniquely defined.
(3) Blackbody Locus and Color Temperature (TC)
The graph on the right shows the spectral distribution curves at different absolute temperatures, based on Planck's radiation law. The higher the temperature, the more energy is emitted, and as the temperature decreases, the energy emitted decreases, and the peak wavelength shifts towards the longer wavelength side. Looking at the graph from the perspective of color, the graph's slope in the visible range (380 – 780 nm) is closely related to color.
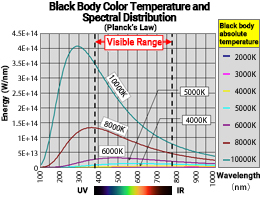
For example, at an absolute temperature of 10,000 K, the graph's slope is steeper than at 8,000 K. When considering the colors of the monochromatic light spectrum in the visible range, 10,000 K has a stronger blue hue than 8,000 K. However, as the temperature decreases, the graph converges along the horizontal axis and becomes almost indistinguishable. To make the slope of the graph in the visible range relatively comparable, the graph has been redrawn with the values at 555 nm for each temperature normalized to 1, as shown in the right figure (only displaying the visible range). This shows that the graph's slope changes continuously with temperature.
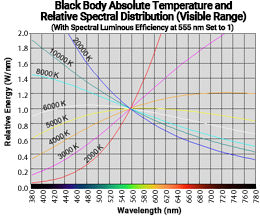
At 2,000 K, the shorter wavelength side is very weak, and the intensity increases rapidly as the wavelength gets longer, indicating a very strong red hue. At around 6,000 K, the graph becomes almost flat, showing little wavelength dependency and appearing colorless (white). As the temperature further increases, the slope reverses, and the blue hue intensifies.
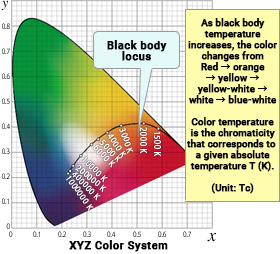
The graph on the right shows the color coordinates (x, y) calculated from relative spectral distribution data for the light emitted by a blackbody at various absolute temperatures, plotted on the xy chromaticity diagram. The curve traces the path from the red area in the bottom right of the chromaticity diagram upwards with increasing temperature through orange, yellow, yellow-white, white, to blue-white. This is called the blackbody locus (Planckian locus). Specifying a blackbody’s absolute temperature value uniquely determines the color coordinates (x, y), giving an intuitive and easy way to associate color with a one-dimensional number (temperature). Therefore, the color temperature (quantity symbol TC) refers to a single value, absolute temperature, which designates the color (chromaticity) of a blackbody.
(4) Correlated Color Temperature (TCP)
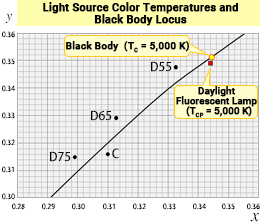
A blackbody is a theoretical construct, but what happens when we add the chromaticity of various real "white" light sources to this diagram? Generally, it is rare for the chromaticity points of these light sources to fall directly on the blackbody locus line. Most often, they appear close to either side of the locus. For example, the chromaticity of a daylight white fluorescent lamp would be plotted slightly below the blackbody locus point for TC = 5,000 K, around (x, y) = (0.344, 0.349).
There are many types of "white light" around us that emit light based on principles different from those of a blackbody. By "borrowing" the color temperature value of the blackbody locus closest to the chromaticity point of the light source, we can represent the hue of the light source with just one number, even if it is less precise. This method is known as correlated color temperature (TCP).
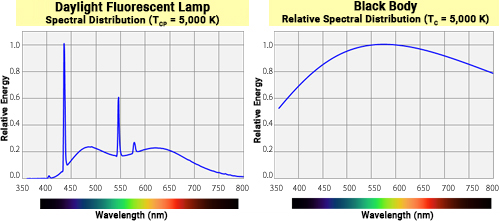
For example, the spectral distribution characteristics of fluorescent lamps are distinct from those of a blackbody, so their chromaticity coordinates generally do not fall directly on the blackbody locus. Instead, the absolute temperature of the lamp's electrodes most closely resembles the light emitted by a blackbody at 5,000 K.
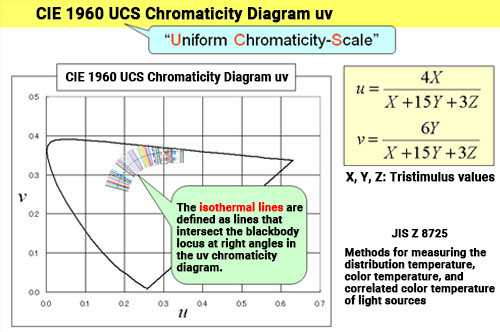
The "closeness" of a chromaticity point is evaluated using color difference, which we explained in the last chapter (Chapter 26). Correlated color temperature uses the CIE 1960 UCS chromaticity diagram (uv chromaticity diagram) (see Comment <<2>> in Chapter 26). If we draw lines from the light source's chromaticity point perpendicular to the blackbody locus, the line will intersect the locus at the point where the color temperature of the blackbody most closely matches the color of the light source. In other words, the correlated color temperature for all chromaticity points on this line corresponds to the color temperature value of the blackbody at this intersection. These lines are known as isotherms.
If we translate the blackbody locus and isotherms from the uv chromaticity diagram back to the xy chromaticity diagram, we get the diagram below. The isotherms, which were perpendicular on the uv diagram, intersect at an angle in the xy chromaticity diagram.
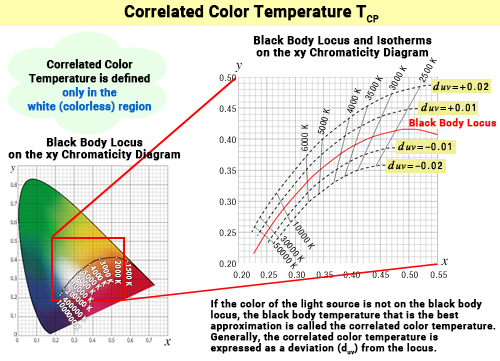
Nearly parallel curves are drawn on both sides of the blackbody locus, which are known as lines of equal deviation. These lines trace the chromaticity points that are equidistant in color difference (duv) from the blackbody locus on the uv diagram (uniform color space). ≪2≫ Above the blackbody locus (towards green), duv > 0, and below (towards red-purple), duv < 0. The further the position of the chromaticity point shifts above the locus (duv > 0) the stronger the greenish hue, and the more it shifts below (duv < 0), the stronger the red-purple hue becomes.
Since correlated color temperature borrows the color temperature value from the blackbody locus that is "closest" to the chromaticity point, the further the light's chromaticity point is from the locus, the more it deviates from the blackbody's color, and the weaker the association between color temperature and the actual hue. Therefore, the concept of correlated color temperature is applicable within a range of about -0.02 ≦ duv ≦ +0.02 (JIS Z 8725: 1999)
(5) Practical Simplification of Using Correlated Color Temperature
To specify a color accurately, you typically need two values for the chromaticity coordinates (x, y). Correlated color temperature is no different, and you must include the deviation duv from the blackbody locus. ≪3≫ But when it comes to white light, the practical advantage of correlated color temperature is that you can get an approximate understanding of the hue with just one number. One example of this is how color temperature helps us estimate the temperature of a star’s surface based on its color. ≪4≫
Comment
≪1≫ Absolute temperature
We are familiar with measuring temperature using Celsius (°C). For instance, ice melts at 0°C, water boils at 100°C under standard pressure, and the average body temperature is around 36.5°C. In contrast, absolute temperature is defined by thermodynamics theory, which rationalizes the thermal motion of atoms and molecules and uses Kelvin (K). At absolute zero (0 K), atomic and molecular vibrations reach a theoretical minimum, and as the temperature rises, the vibrations become stronger. The relationship between Celsius temperature (t°C) and absolute temperature (TK) is as follows:
Absolute Temperature T [K] = Temperature Celsius t [°C] + 273.15
Thus, in terms of absolute temperature, the melting point of ice is 273.15 K, the boiling point of water is 373.15 K, and body temperature is just under 310 K.
≪2≫ Definition of deviation duv from the blackbody locus (JIS Z 8725: 1999)
us, vs: CIE 1960 UCS chromaticity coordinates (uv coordinates) of the light source
u0, v0: Coordinates on the blackbody locus closest to the chromaticity coordinates of the light source on the CIE 1960 UCS chromaticity diagram
≪3≫ Color temperature and correlated color temperature
"Correlated color temperature" is often referred to simply as "color temperature" in general discourse. However, they are not interchangeable as they have entirely different definitions.
≪4≫ Star color and surface temperature
For example, Sirius (Canis Major constellation) has a slight blue-white color and has a surface temperature (absolute temperature) of just under 10,000 K. Our solar system's sun appears as a white tinged with yellow during a clear midday sky, with a temperature of around 6,000 K. Betelgeuse (Orion constellation) appears quite red, with a temperature of about 3,500 K.
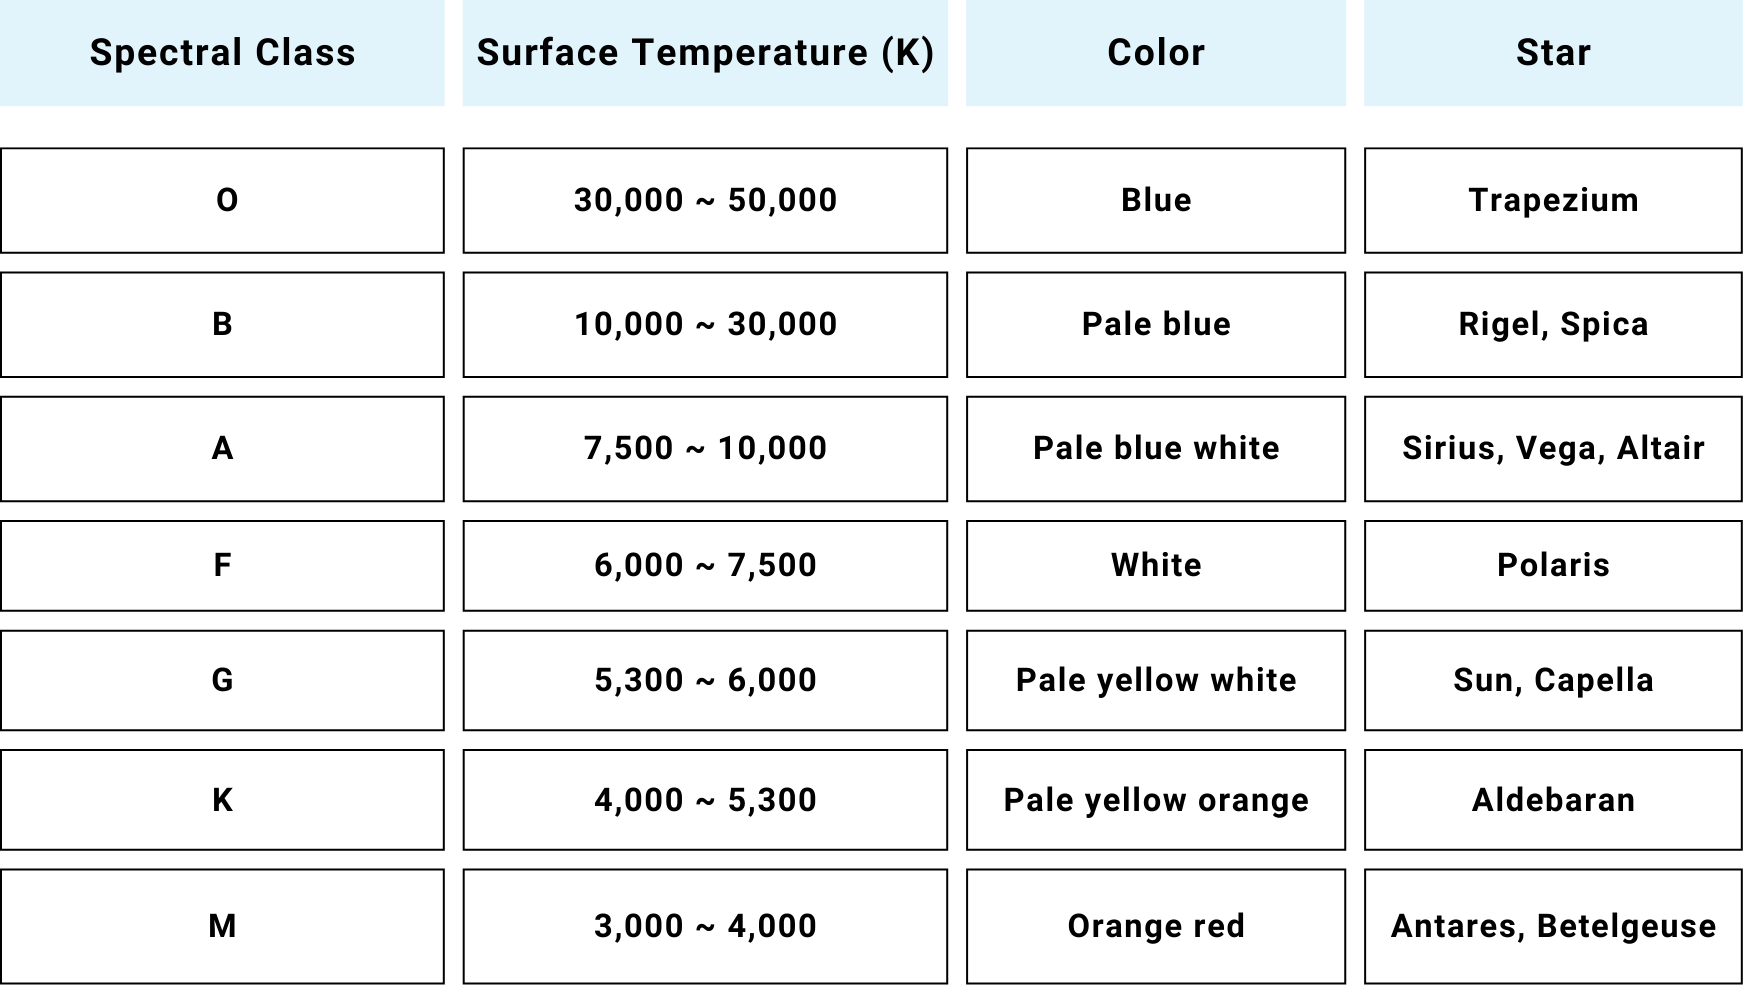
Stars cannot be strictly described as pure thermal radiation light sources, and the situation is complicated by factors such as absorption by intervening gas layers. However, it is generally thought that they follow similar principles, so their surface absolute temperature can be estimated from the correlated color temperature deduced from their color. The surface temperatures of various stars are thought to correlate with their approximate spectral type (spectral distribution) as shown in the above table.