Theory of Light and Color
39. Key Points
When Evaluating the Optical Characteristics of LEDs (Part 2)
In the previous chapter (Chapter 38), we discussed two major reasons why measurement results for the optical characteristics of LED light sources can vary:
1. Misalignment between the three optical axes involved in LED chip packaging: the structural axis, optical axis, and the axis of maximum luminous intensity.
2. The shift of the emission wavelength to a longer wavelength due to the rise in temperature of the LED's semiconductor junction when it is powered on.
This chapter gives an overview of other contributing factors.
(1) The Problem of Chromatic (Spectral) Photometric Error
Chromatic photometric error was briefly discussed in Chapter 35, "Tips for Using Illuminance Meters," in Comment ≪1≫ about spectral error, and again in the previous chapter (Chapter 38) under "Challenges with CIE Averaged LED Intensity." Chromatic photometric error is not limited to illuminance or luminous intensity measurements—it can generally occur with various photometric and colorimetric quantities.
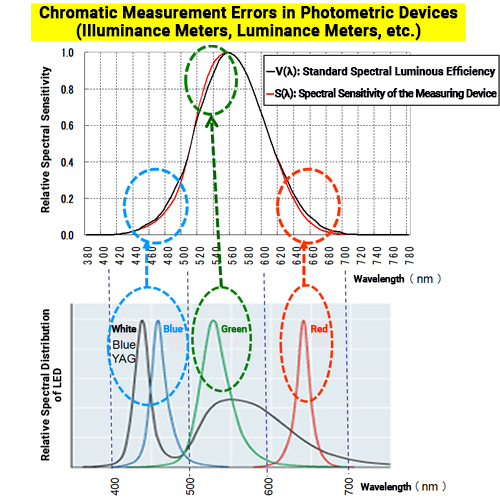
In the case of photometric quantities, the standard spectral luminous efficiency function V(λ) is used as the theoretical evaluation function. For colorimetric quantities, the color matching functions x (λ), y (λ), z (λ) are used. However, actual photometric and colorimetric instruments, especially filter-type ones, often don't perfectly match these theoretical spectral response curves. As shown in the diagram on the right, measurement errors caused by wavelength-dependent differences between the instrument's response and the ideal function are referred to as chromatic photometric error. ≪1≫
The actual instrument's spectral response can show both positive and negative deviations from the theoretical function, depending on the wavelength. For light sources like white LEDs, which have a wide spectral distribution across the visible range, these errors tend to cancel each other out. But for non-white light sources with highly skewed spectral distributions, such as red, green, or blue monochromatic LEDs, if the LED's spectral output overlaps with the wavelength ranges where the measurement device has larger errors, the chromatic photometric error becomes more significant.
This isn't a problem unique to LEDs. It can also apply to traditional light sources with narrow or uneven spectral distributions, such as red or blue colored lamps or white sources like mercury lamps that have sharp line spectra. However, because there are many types of monochromatic LEDs in use today—and because they are often measured—it's something users should always keep in mind. ≪2≫ If you need accurate absolute values for optical characteristics, it's generally best to use spectral-type photometric or colorimetric instruments, since they are less prone to chromatic photometric error by design.
However, if you're only comparing multiple light samples with the same relative spectral distribution, then chromatic photometric errors will occur at the same ratio for each. In such cases, absolute values aren't as important, so filter-type instruments (which directly read tristimulus values) are often acceptable for practical use.
That said, even among the same model of filter-type instruments, the spectral response may vary slightly between individual units. It is best to use just one single instrument for all your measurements if doing a comparison.
(2) Unstable Factors in LED Luminance Measurement
Because LEDs have extremely small light-emitting areas, luminance measurements tend to have more error compared to other types of light sources.
As mentioned in Chapter 36, "Tips for Using Luminance Meters", luminance meters display the average luminance within a small measurement area shown inside the viewfinder. However, with LED light sources, the emitting area is often so small that even within that small measurement area, the luminance can vary significantly. As a result, even slight differences in positioning can cause noticeable changes in the measured value. Using a close-up lens to magnify the LED image doesn't always solve this issue with uneven luminance distribution.
Also, since luminance is measured based on light emitted into a narrow solid angle, it's important—just like in luminous intensity measurements discussed in the previous chapter (Chapter 38)—to consider the light distribution characteristics of the sample light source. For light sources with a smooth, nearly uniform diffuse distribution, there is little variation in luminance measurements due to changes in the measurement angle. However, many LED light sources have focused beams with strong directionality. In these cases, even small changes in the measurement angle can lead to noticeable differences in luminance readings.
In addition, because the structural axis, optical axis, and maximum luminous intensity axis may not align in an LED, a slight difference in measurement angle, or in how the LED sample is set up, can also cause luminance readings to vary.
(Everything above about luminance also applies in the same way to radiance measurements.)
(3) Issues with Measuring the Total Luminous Flux of LEDs
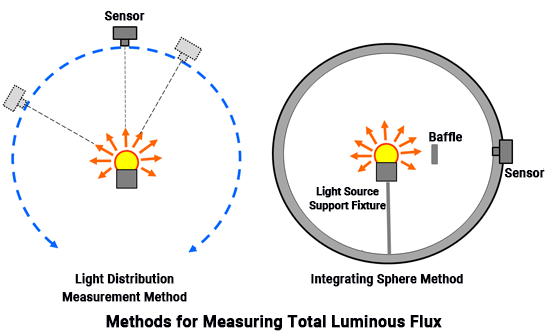
In general, there are two main methods for measuring the total luminous flux of a light source:
[Light distribution method]
This measures the light emitted in all directions by collecting data from points on a spherical surface around the light source. It creates a 3D light distribution map, then calculates the total luminous flux using numerical integration.
[Integrating sphere method]
This method uses an integrating sphere (a spherical photometer). The test light source is placed at the center and turned on. Light emitted by the source reflects multiple times inside the sphere and becomes evenly diffused. The brightness (illuminance) of the inner surface of the sphere is measured. Since this illuminance is proportional to the total luminous flux, the total flux can be calculated. ≪3≫
The light distribution method can be used with any type, shape, or structure of light source and get an accurate flux calculation. However, precise measurement requires a large and complex setup, usually inside a dark room. It also takes time since measurements must be taken repeatedly from all directions, and the light source must remain stable throughout. High-level measurement techniques are required.
On the other hand, the integrating sphere method simplifies things by using the reflected, diffused light to average the light across all directions. The illuminance of the sphere's inner wall is then compared to a calibrated reference light source to determine the total luminous flux. Because this method compares the inner wall illuminance between the reference light source and the test light source, it is relatively quick and easy and thus commonly used in practice. However, since light reflects many times inside the sphere, it can be absorbed by parts of the test light source itself or other components in the setup, such as the baffle. These losses—called self-absorption—cause measurement errors and require correction. ≪4≫
With LED light sources, self-absorption errors are often significant and must be handled carefully. For LEDs mounted in packages, the actual light-emitting part (the LED chip) is very small, while the non-emitting parts (the casing and supports) take up much more space. This increases the ratio of self-absorption compared to a standard light source, which can significantly affect the results. LED packages can also come in different shapes, which affects the degree of self-absorption and makes it difficult to eliminate measurement variability, even with corrections.
(Everything above also applies to total radiant flux measurements, not just luminous flux.)
(4) Reducing Self-Absorption Errors Using an Integrating Hemisphere
A measurement method has been developed using an integrating hemisphere to address the issues of self-absorption. ≪5≫ This method splits a traditional integrating sphere in half and installs a flat mirror at the cut. The image of the inside of the real hemisphere is reflected as a virtual image in the flat mirror. Together, the real hemisphere and its mirror image function as a complete integrating sphere.
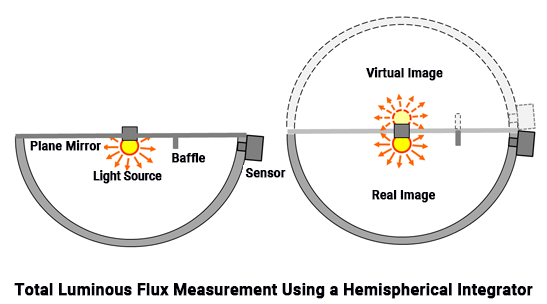
From the center of the flat mirror (which is also the center of the hemisphere), only the light-emitting part of the test light source is positioned to "peek out" into the hemisphere. The non-emitting parts that cause most of the self-absorption are hidden behind the flat mirror. Since the setup also doesn't require any support fixtures inside the hemisphere, there is significantly less self-absorption.
(5) Absolute Value Measurement and Relative Comparison Measurement
The absolute value of the optical properties of a test light source (such as photometric or radiometric quantities) must be measured by strictly following the definition of the measurement quantity, carefully setting the measurement conditions, and using precisely calibrated instruments. Because of this, accurate measurement requires a large-scale measurement environment (such as specialized equipment and a controlled laboratory setting) and advanced measurement techniques. It is not something just anyone can easily do.
In contrast, relative comparison measurement uses a reference sample (a photometric standard light source) that has already been assigned a precise characteristic value through absolute measurement as described above. You then compare the test sample and the standard light source under the same measurement conditions. From the relative ratio of the measured values, you can determine the absolute value of the test sample.
Relative comparison measurement still requires measurement conditions based on the proper definitions of the measurement quantity, but even if the equipment and environment are not ideal, or the person performing the measurement is not highly experienced, this method can still produce accurate results. It is much easier for anyone to perform compared to absolute value measurement.
(In the total luminous flux measurement described above, the light distribution method is an absolute value measurement, while the integrating sphere method is a relative comparison method.)
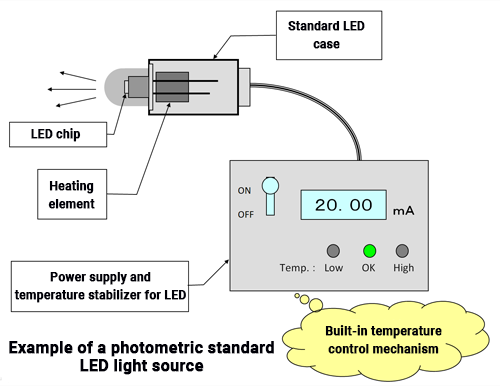
(6) Use of Photometric Standard LEDs
As we've discussed, the optical properties of LED light sources have unique characteristics that are different from conventional light sources. These differences can easily lead to measurement errors, so measurement results tend to show large variations. This makes it especially challenging when accurate absolute values are required.
To address these issues, there are photometric standard LED light sources, whose values are defined through absolute measurement for various radiometric and photometric quantities. ≪6≫ These standard LEDs come with a dedicated power supply. Not only are they driven under specific, pre-set conditions (voltage, current), but they also feature a temperature stabilization system that heats the LED chip to a specific temperature. This prevents the chip from being affected by ambient temperature. The LED's light output stabilizes after being on for a certain amount of time, and that stable output is the value used as a reference. By comparing the test LED to the photometric standard LED under the same measurement conditions, the absolute value of the test LED can be calculated.
In theory, the photometric standard LED should be the same type (same relative spectral distribution) and have the same shape and size as the test LED. However, there is a limited number of photometric standard LEDs available on the market, while there are many different types of LEDs. In most cases, we can only compare the test LED to a standard LED that is most similar in specifications. Even so, this method still provides results that are much closer to the true value with relatively less effort compared to measuring the absolute value on its own under imperfect measurement conditions.
Up to this point, we've covered various details regarding the measurement and evaluation of LED light source optical properties. As of 2018, technology to take absolute measurements of LED optical characteristics does not have the same level of accuracy as it does for traditional light sources. Many challenges remain despite continuous efforts made to improve the technology, and it seems likely that this situation will persist for some time.
Therefore, when using LED light sources, it's important to choose models and design systems based on your system's purpose, required accuracy, and other conditions. Instead of relying on catalog values for photometric or radiometric quantities at face value, it is better to expect a certain degree of variation (or fluctuation) when planning your design.
Comment
≪1≫ Chromatic photometric error
This is called "chromatic photometric error" because the way the error occurs differs depending on the spectral distribution (the color) of the sample light.
≪2≫
We mentioned monochromatic LEDs as an example where chromatic photometric error is more likely to occur. However, even with white LEDs, such as Blue-YAG type white LEDs where the blue excitation component is strong, chromatic photometric error can still occur easily.
≪3≫ Uniform wall illuminance from multiple uniform diffuse reflections in an integrating sphere
The inner wall of the integrating sphere is coated with a high-reflectance, white, uniform diffuse substance (such as barium sulfate or Spectralon). When a portion of the light emitted from the light source travels in a certain direction (luminous flux A) and hits a point P on the inner wall, it is diffusely reflected with a very high reflectance (close to 100%).
In other words, the luminous intensity of the reflected light is proportional to cos θ, where θ is the angle of reflection. These reflected rays then strike other parts of the sphere's inner wall, such as points Q1 or Q2. According to geometric optics theory, the illuminance at those points remains the same regardless of the reflection angle θ at point P. The same kind of diffuse reflection occurs at Q1 and Q2 as well.
Through repeated diffuse reflections of all the light, the illuminance across the entire inner surface of the integrating sphere becomes uniform—regardless of the light source's original distribution pattern.
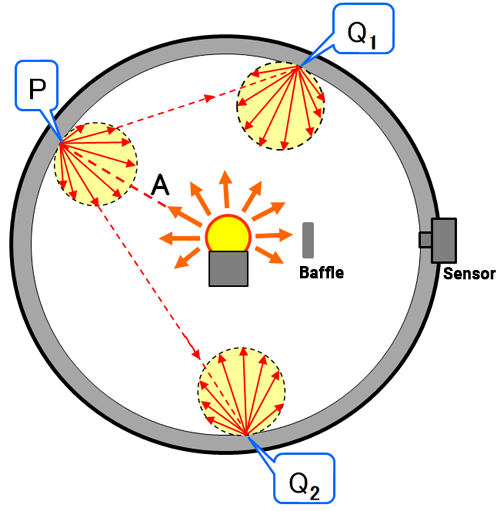
If any direct light from the test light source enters the sensor (lux meter) installed on the sphere wall, the sensor reading will be affected by the directional intensity of that direct light. To prevent this, a baffle is used to block the direct beam, so that the sensor only measures illuminance from uniformly reflected light inside the sphere.
≪4≫
If the light distribution of the standard light source and the test light source is different, it can lead to measurement errors.
≪5≫
The integrating hemisphere method was developed by Otsuka Electronics Co., Ltd.
≪6≫ Photometric standard LED light sources
Various types are available, such as standard LEDs for total spectral radiant flux, standard LEDs for luminous flux and radiant flux, and standard LEDs for luminous intensity. These LEDs are carefully calibrated under precise measurement environments using advanced techniques to determine their absolute values for the relevant photometric or radiometric quantities. These values are traceable to national measurement standards.